


Contents
- 1 Cold Email Statistics – TOC
- 2 How I Collected This Data
- 3 Top 13 Cold Emailing Statistics to Watch in 2026 Before Sending Cold Emails
- 3.1 1. The Average Cold Email Reply Rate Is 3.7%
- 3.2 2. Cold Email Open Rates Average 21%
- 3.3 3. Cold Email Subject Lines With 4 to 5 Words Get the Highest Open Rates
- 3.4 4. Google Workspace Delivers 97% of Cold Emails
- 3.5 5. Hyper-Personalized Campaigns Under 200 Prospects Get 2x More Replies
- 3.6 6. Emails With One Clear Soft CTA Get 78% More Positive Replies
- 3.7 7. Follow-Up Emails Generate 44% of Positive Replies
- 3.8 8. Verified Prospect Lists Bounce 40% Less Than Unverified Lists
- 3.9 9. Tuesday Between 9–10 AM Is the Best Cold Email Window
- 3.10 10. SaaS Is the Easiest Industry to Break Into With Cold Email
- 3.11 11. The Job Titles Most Likely to Reply Change With Company Size
- 3.12 12. North America Leads All Regions in Cold Email Reply Rates
- 3.13 13. The Cold Email Conversion Rate Is 2 to 3 Meetings Per 100 Cold Emails
- 4 4 Cold Email Trends to Watch in 2026
- 5 Frequently Asked Questions About Cold Email Statistics
- 5.1 1. What Is a Good Cold Email Reply Rate in 2026?
- 5.2 2. What Is the Average Cold Email Open Rate?
- 5.3 3. How Many Follow-Ups Should I Send for a Cold Email?
- 5.4 4. What Is an Acceptable Bounce Rate for Cold Email?
- 5.5 5. How Long Should a Cold Email Be?
- 5.6 6. What Is the Best Day and Time to Send Cold Emails?
- 5.7 7. What Is the Cold Email Conversion Rate to Meetings?
- 5.8 8. Does Email Verification Actually Improve Cold Email Results?
- 5.9 9. Does Adding a Second Channel Improve Cold Email Results?
- 5.10 10. What Size Prospect List Gets the Best Cold Email Results?
I analyzed 53 million cold emails sent from January to June 2026 across 23,000+ user profiles.
Here’s what actually works in 2026 👇🏼
- Google Workspace outperformed Microsoft 365 and was the most widely used ESP.
- The average cold email reply rate is 3.7%, but the best campaigns can hit 10%+.
- Small and micro-segmented sequences with <200 prospects generate nearly 2x more replies than large ones.
- North America delivers the highest reply rates, and SaaS is the most responsive industry.
- Positive Reply Rate is the metric that matters most now.
- 44% of all positive replies come from follow-ups, making them essential for your pipeline.
- Top-performing campaigns convert at 2–3 meetings for every 100 emails sent.
These are just a few of the many stats I found. In this post, I break down the full benchmarks on reply rates, open rates, follow-ups, deliverability, personalization, timing, and ROI.
Let’s get into it.
Cold Email Statistics – TOC
How I Collected This Data
This benchmark report is based on an analysis of 53.1 million cold emails and 60,000 cold email sequences sent through Saleshandy between January and June 2026.
The dataset includes activity from 67.4 million connected email accounts across Google Workspace, Microsoft 365, Zoho, Custom SMTP, and Azure.
All metrics have been aggregated and anonymized to protect benchmark accuracy and user privacy.
The findings in this report are intended to help sales teams understand how campaign structure, email content, sender infrastructure, and timing impact cold outreach performance at scale.
1. Engagement Metrics
Every reply received during the study period was processed through Saleshandy’s AI and classified as Interested, Not Interested, Auto-Reply, Out of Office, or Do Not Contact.
Using these classifications, we calculated two benchmarks:
- Reply Rate: Total replies received ÷ total emails delivered
- Positive Reply Rate: Interested replies ÷ total emails delivered
Reply rate reflects overall engagement, while positive reply rate reflects real prospect intent.
2. Deliverability Metrics
We tracked inbox placement and bounce rates across all campaigns.
- Inbox Placement Rate: Delivered to primary inbox ÷ total sent
- Bounce Rate: Emails that failed delivery ÷ total sent
We also analyzed ESP-level deliverability differences across providers.
3. Campaign Structure
- Prospect list size
- Number of sequence steps
- Follow-up intervals
- Outreach channels (email, LinkedIn, cold calling)
These inputs were mapped against reply performance to identify patterns.
4. Content Variables
- Email word count
- Subject line length
- Personalization method
- CTA type
We grouped similar campaigns to compare performance benchmarks.
5. Sender Infrastructure
We analyzed ESPs including Google Workspace, Microsoft 365, Zoho, Custom SMTP, and Azure.
- Number of sending accounts
- Domain age
- Warm-up maturity
- Daily sending volume
This helped identify how infrastructure impacts deliverability and replies.
6. Timing Variables
- Day of the week
- Hour of sending
- Recipient timezone alignment
We compared timing against reply and positive reply rates to identify optimal sending windows.
Top 13 Cold Emailing Statistics to Watch in 2026 Before Sending Cold Emails
We track these numbers every quarter to stay ahead of what’s working and what’s shifting.
Here is what our latest analysis revealed.
1. The Average Cold Email Reply Rate Is 3.7%
When we analyzed cold emails sent between January and June 2026, we found that the average cold email reply rate was 3.7%.
However, not all campaigns perform the same.
While the average campaign generated a reply rate between 3% and 5%, the highest-performing campaigns consistently achieved reply rates above 10%.
| Performance Group | Reply Rate |
|---|---|
| Top 1% Campaigns | 15% – 30% |
| Top 5% Campaigns | 11% – 15% |
| Average Campaigns | 3% – 10% |
Based on our dataset, a reply rate between 3% and 5% represents a healthy benchmark for most cold email campaigns.
Campaigns consistently generating 7%+ replies are outperforming the market, while those exceeding 10% are among the strongest performers in our dataset.
What Is a Positive Reply Rate and Why Does It Matter in 2026?
A reply doesn’t always mean a sales opportunity.
Many responses are automatic replies, unsubscribe requests, out-of-office messages, or prospects who simply aren’t interested.
To understand reply quality, we analyzed every response using Saleshandy’s AI reply categorization system and classified them as Interested, Not Interested, Auto-Reply, Out of Office, or Do Not Contact.
The average positive reply rate across our dataset was 3% to 5%.
Highly personalized campaigns or targeted niche offers can push positive rates to 10% or higher.
Among the strongest campaigns in our dataset, between 25% and 50% of all replies were classified as interested.
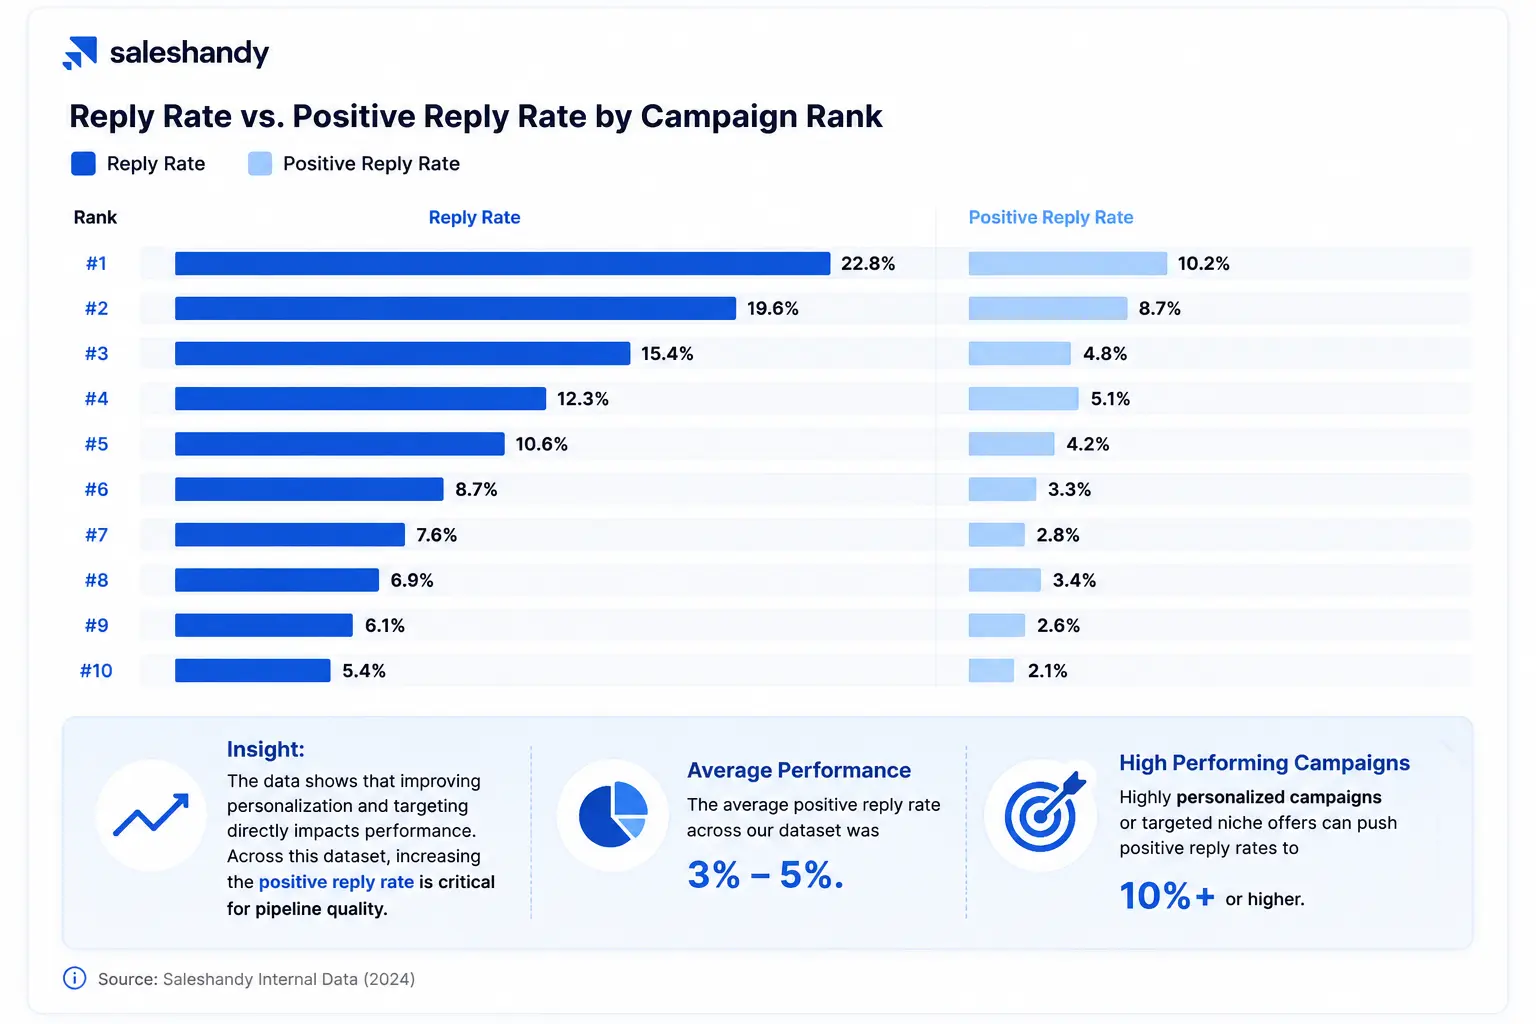
This is why positive reply rate serves as the primary benchmark throughout this report, it measures actual buying intent rather than overall engagement.
Tips to Improve Your Positive Cold Email Reply Rate
Micro-segment prospects before writing emails Create separate sequences for each buyer persona because a VP of Sales may care about pipeline growth, while a Sales Manager focuses on rep productivity.
Use contextual opening lines “I read your LinkedIn post about hiring SDRs and noticed you’re expanding the team this quarter.”
Write short, hyper-relevant subject lines “Hiring 12 SDRs this quarter?” instead of “Quick Question”.
Keep first-touch emails under 100 words Focus on one problem, one value proposition, and one CTA.
Do ESP matching Matching sender and recipient ESPs is consistently associated with stronger inbox placement and reply rates.
Lead with the prospect’s problem Prospects don’t care what you sell first. Start with their pain point and then position your solution briefly.
Use soft CTAs Use low-friction CTAs like “Worth exploring?” or “Does this resonate—open to a quick chat next week?”
2. Cold Email Open Rates Average 21%
The average open rate across our platform was 21%.
That means roughly 1 in 5 cold emails gets opened, or at least appears to get opened.
We say “appears to” because open rate has become one of the least trustworthy metrics in cold email.
Why Open Rate Is No Longer a Reliable Metric
Open rate is primarily a subject line metric.
A high open rate usually indicates that your subject line earned enough attention to get opened, while a low open rate suggests it didn’t.
Remember, if you have a 15% open rate and a 3% positive reply rate, you’re in a much better position than someone with a 50% open rate and zero meetings booked.
And track open rate to test subject lines and monitor deliverability.
💡 The body content, CTA, and relevance of your message are actually what drive replies.
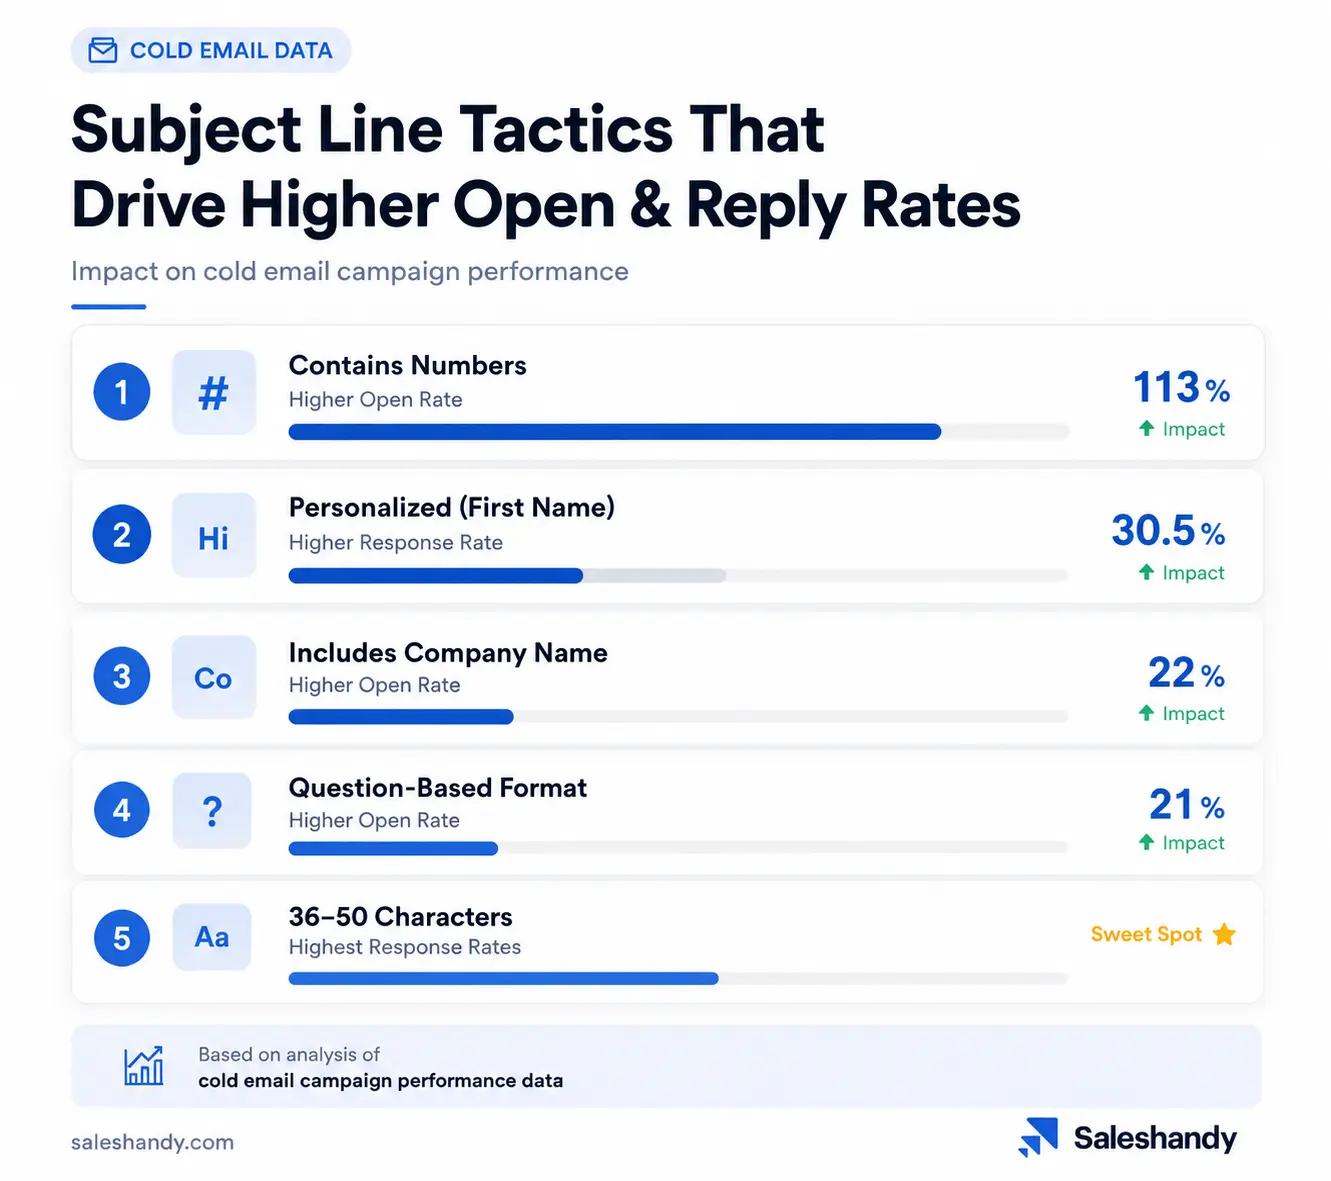
3. Cold Email Subject Lines With 4 to 5 Words Get the Highest Open Rates
Across million cold emails, subject lines with 4 to 5 words consistently outperformed every other length bracket.
Shorter than 3 words felt incomplete. Longer than 6 started getting ignored or truncated on mobile.
Here’s what the data says about subject line performance:
Best Practices to Write Cold Email Subject Lines
- Keep it to 4 to 5 words (36 to 50 characters).
- Avoid colons and quotes. Both trigger spam scoring on Microsoft 365 and Outlook.
- Stop using Re: and Fwd: prefixes. Every major inbox provider flags them now. They go straight to spam.
- Pull keywords from the prospect’s own words. Scrape what they said on LinkedIn, G2 reviews, or Reddit. Mirror their pain in your subject line.
- Skip ALL CAPS. Penalized across every ESP in the dataset.
4. Google Workspace Delivers 97% of Cold Emails
Your email provider directly affects whether your cold emails reach the inbox.
When we analyzed deliverability data across Google Workspace, Microsoft 365, Zoho, Azure, and custom SMTP setups, we found noticeable differences in bounce rates between providers.
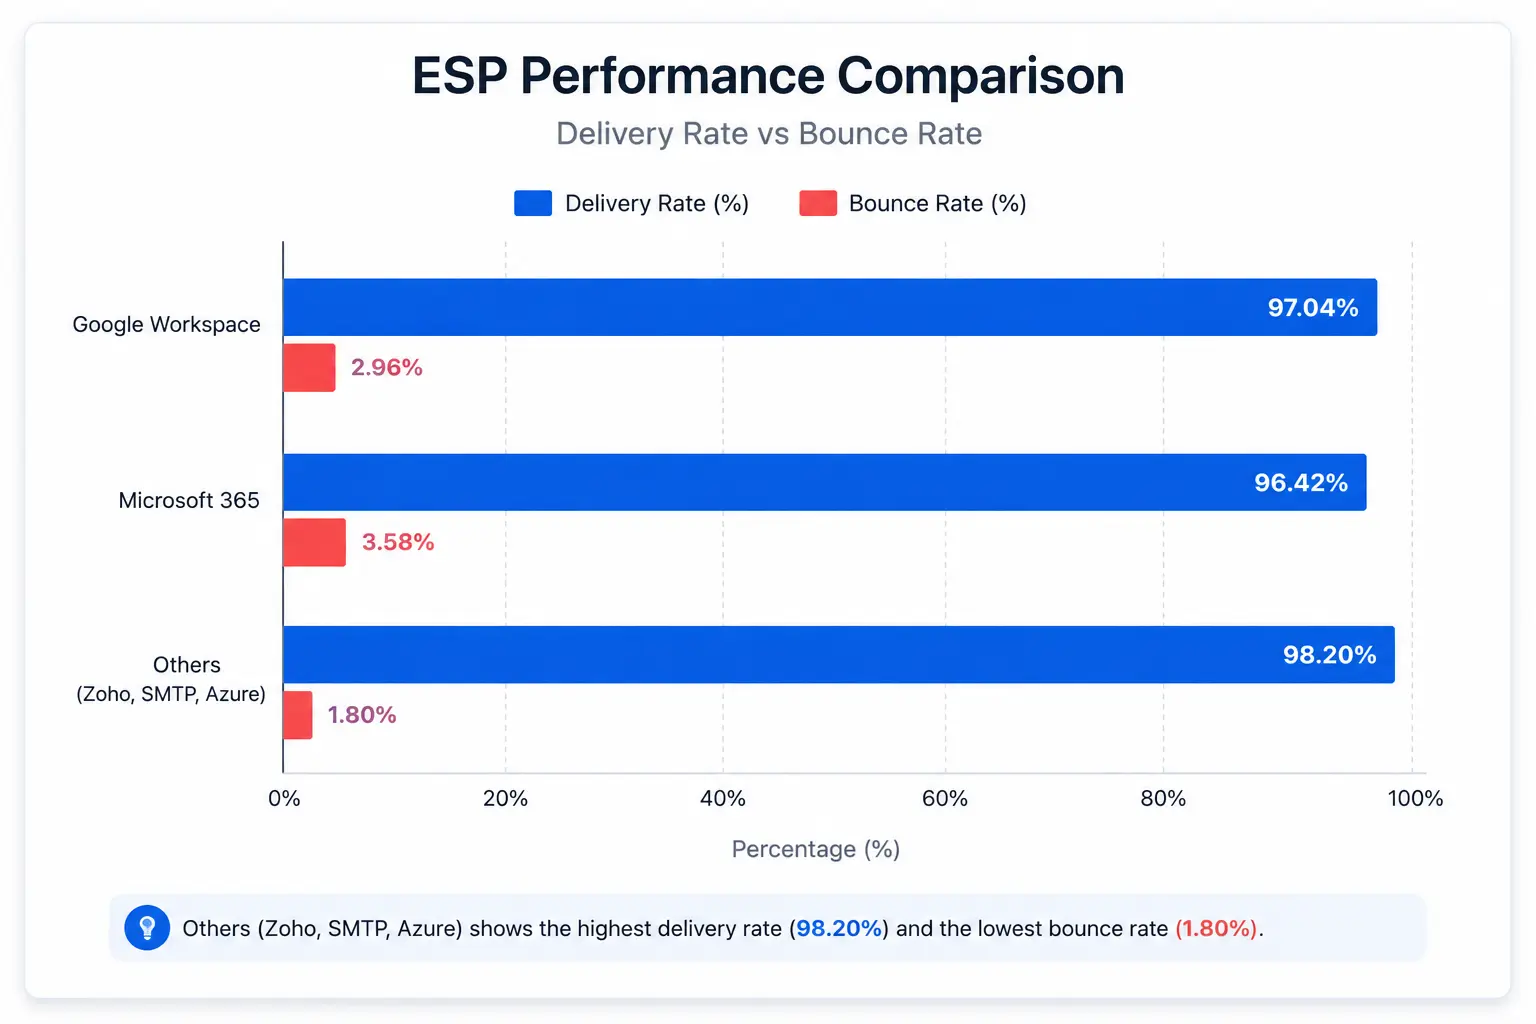
Google Workspace was the most widely used sending provider in our dataset, accounting for 44% of all cold emails sent.
Microsoft 365 handled 33%, while Zoho, Azure, and custom SMTP providers made up the remaining 23%.
However, the biggest surprise came from the “Others” category, where custom SMTP and Azure-based setups achieved the lowest bounce rate in the dataset at just 1.80%.
Deliverability Best Practices You Should Follow in 2026
- ESP matching is ensuring maximum inbox placement
- Warm up inboxes in the same industry you plan to prospect into.
- Monitor deliverability separately for each ESP.
- Keep bounce rates under control by regularly cleaning and verifying prospect lists.
- Continuously monitor inbox placement across Google Workspace and Microsoft 365 environments.
5. Hyper-Personalized Campaigns Under 200 Prospects Get 2x More Replies
One of the clearest patterns in our dataset was the relationship between campaign size and reply rate.
As campaign size increased, reply rates declined.
| Campaign Size | Sequences | Emails Sent | Reply Rate |
|---|---|---|---|
| Under 200 Prospects | 103,255 | 4.55M | 15–20% |
| 200–500 Prospects | 7,119 | 4.47M | 11–13% |
| 500–1,000 Prospects | 3,827 | 4.45M | 8% |
Campaigns targeting fewer than 200 prospects generated nearly twice the reply rate of campaigns targeting 500+ prospects.
The campaigns generating the highest reply rates weren’t necessarily sending fewer emails overall.
Instead, they divided their outreach into smaller, highly targeted segments.
Rather than building one campaign for 1,000 prospects, they built multiple campaigns for specific audiences with specific problems.
For example one for:
- VPs of Sales
- Sales Managers
- SDR Leaders
- SaaS companies hiring SDRs
- Companies that recently raised funding
Each segment received messaging tailored to its priorities, challenges, and buying triggers.
As campaign size grows, senders are often forced to broaden their targeting and simplify their messaging.
The result is an email that applies to more people but resonates with fewer of them.
6. Emails With One Clear Soft CTA Get 78% More Positive Replies
The best cold email in the world won’t book a meeting if the CTA scares the prospect away.
When we compared CTA styles across the dataset, emails with a single soft CTA generated 78% more positive replies than emails with hard CTAs. Emails with multiple CTAs performed worst of all.
Hard CTAs vs Soft CTAs
Hard CTAs ask prospects to commit before they’ve built trust. Soft CTAs simply ask them to respond.
That one difference had a significant impact on positive reply rates.
Hard CTAs Examples (declining performance in 2026):
- “Let’s get on a meeting this week.”
- “Book a two-minute test drive.”
- “Here’s my calendar link, pick a slot.”
Soft CTAs Examples (highest positive reply rates in our dataset):
- “Would love to communicate more on this.”
- “Would like to know more entrepreneurs like you.”
- “This is a wonderful networking opportunity and I’d love to know you more.”
- “Worth a quick chat?”
- “Does this resonate?”
Interestingly, many of the best-performing CTAs in 2026 focused on asking for a response, not a commitment.
Prospects could engage without agreeing to a demo, sales call, or calendar invite.
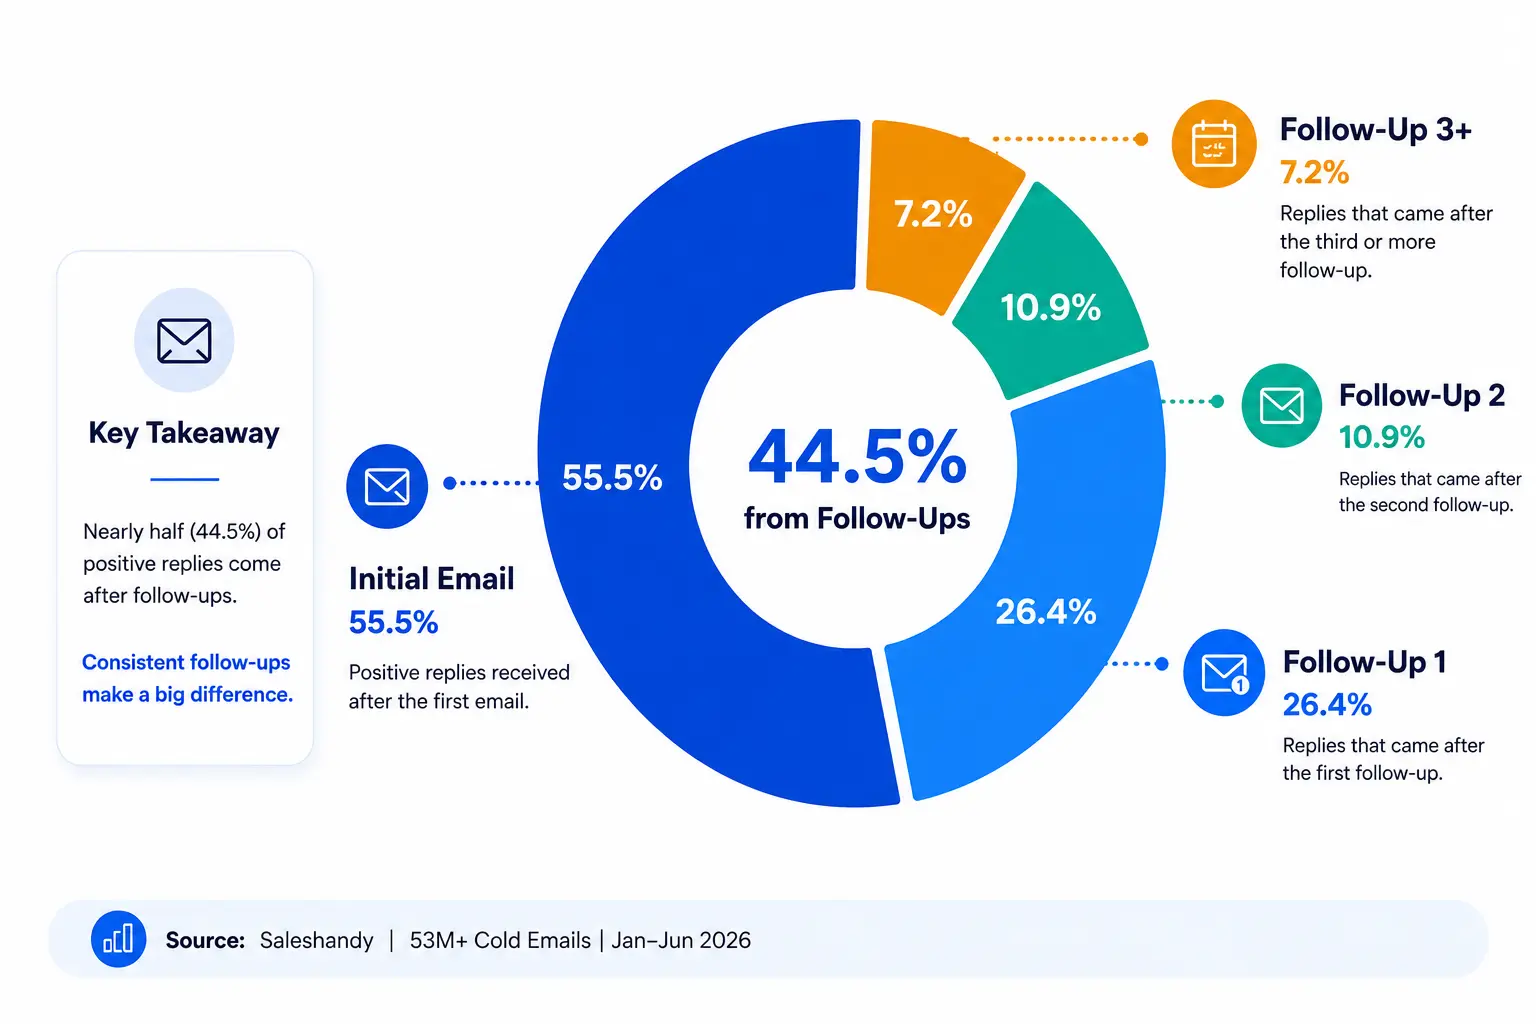
7. Follow-Up Emails Generate 44% of Positive Replies
44% of all positive replies came from follow-up emails, not the initial outreach.
The first follow-up alone generated 26% of all positive replies, making it the single most valuable email in the sequence after the opener.
| Email Step | Replies | Positive Replies | % of All Positive Replies |
|---|---|---|---|
| Follow-Up 1 | 116,920 | 15,626 | 26.41% |
| Follow-Up 2 | 60,473 | 6,436 | 10.88% |
| Follow-Up 3+ | 30,063 | 4,276 | 7.23% |
While reply volume declined with each additional touchpoint, follow-up emails continued to generate meaningful positive replies throughout the sequence.
The data suggests that many prospects don’t respond because they are busy, distracted, or not ready to engage when the first email arrives. Follow-ups create additional opportunities to start the conversation.
What We Observed in Sequences That Generated More Follow-Up Replies
- Most successful sequences contained 4 to 6 follow-up emails and have 20 to 21 days total sequence length.
- The strongest follow-ups introduced a new insight, use case, or conversation angle rather than repeating the original message.
Spacing by buyer persona:
- Decision makers (VPs, C-suite): 2 to 3 day intervals
- Users and managers: 24 to 48 hour intervals
8. Verified Prospect Lists Bounce 40% Less Than Unverified Lists
Bad data hurts campaign performance before your prospect even sees the email.
When we compared verified and unverified prospect lists, verified contacts consistently generated lower bounce rates and better deliverability.
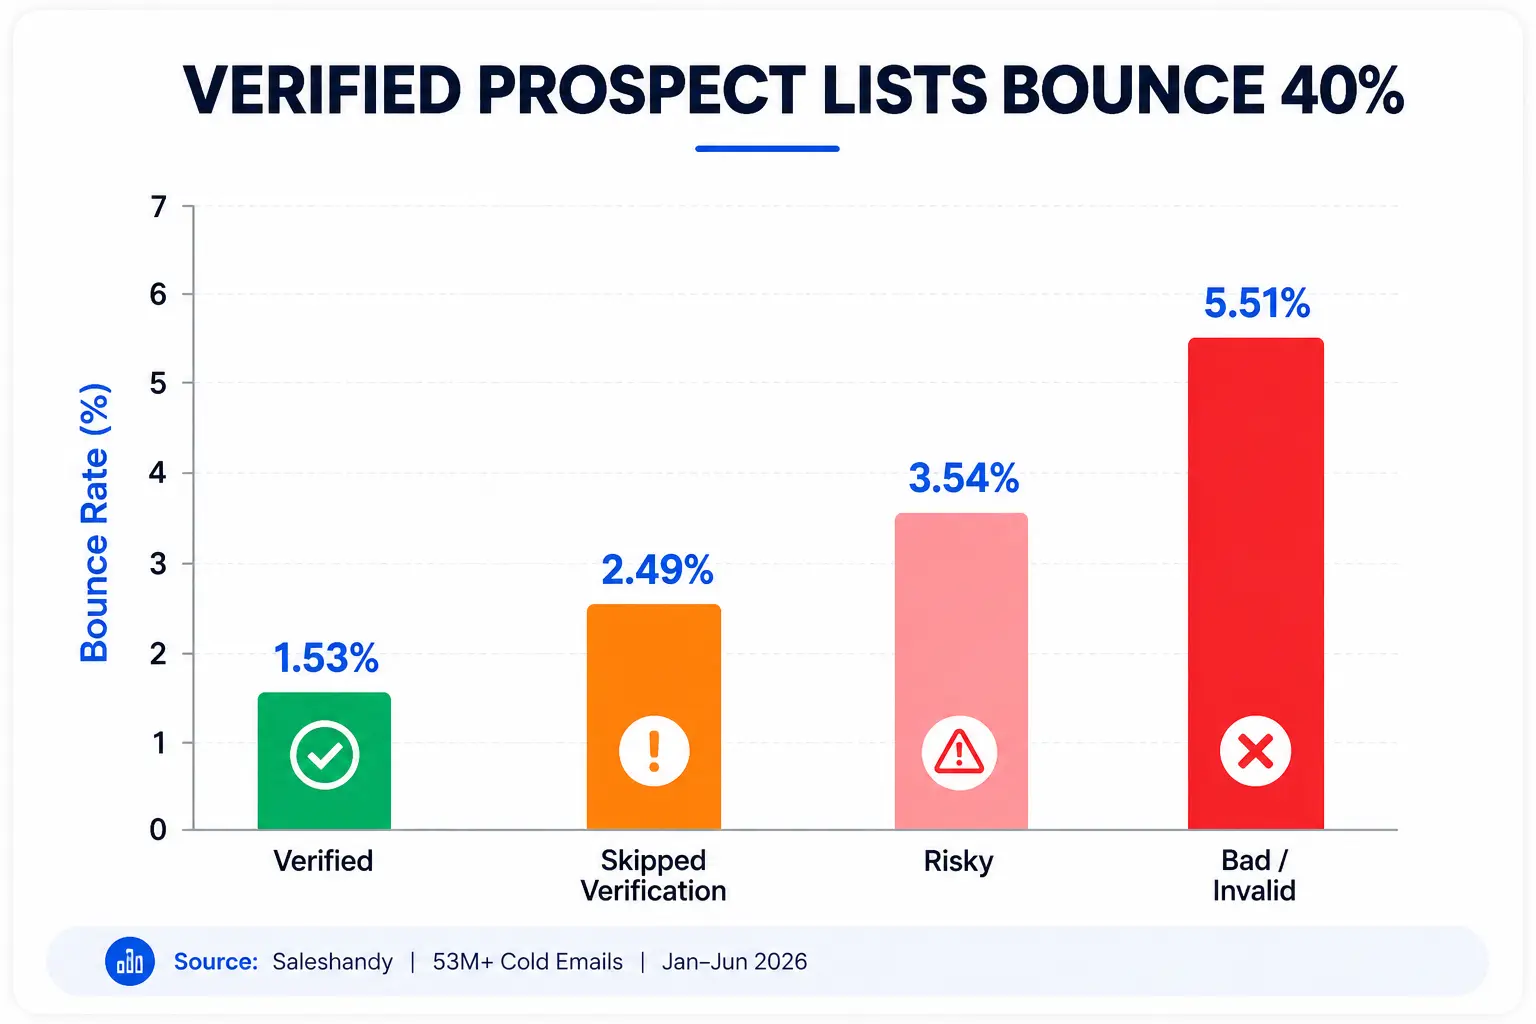
Unverified contacts bounced 40% more often than verified contacts.
Every bounce affects sender reputation. As bounce rates increase, inbox placement typically declines, making it harder for future campaigns to reach the primary inbox.
💡Key Takeaway: Always verify your prospect list before launching a cold email campaign.
9. Tuesday Between 9–10 AM Is the Best Cold Email Window
When we analyzed send times across the dataset, Tuesday between 9 and 10 AM in the prospect’s local timezone consistently generated the highest reply rates.
Tuesday, Wednesday, and Thursday generally outperformed the rest of the week, while Monday mornings and Friday afternoons generated the lowest engagement.
Regional Differences We Observed
- In the US and UK, emails sent between 8–10 AM local time generated the highest reply rates.
- Across APAC markets, afternoon sends consistently outperformed morning sends.
- Don’t send cold emails after Friday 2 PM.
- Sending in the prospect’s local timezone performed better than using a single global sending schedule.
10. SaaS Is the Easiest Industry to Break Into With Cold Email
Cold email performance varies significantly by industry.
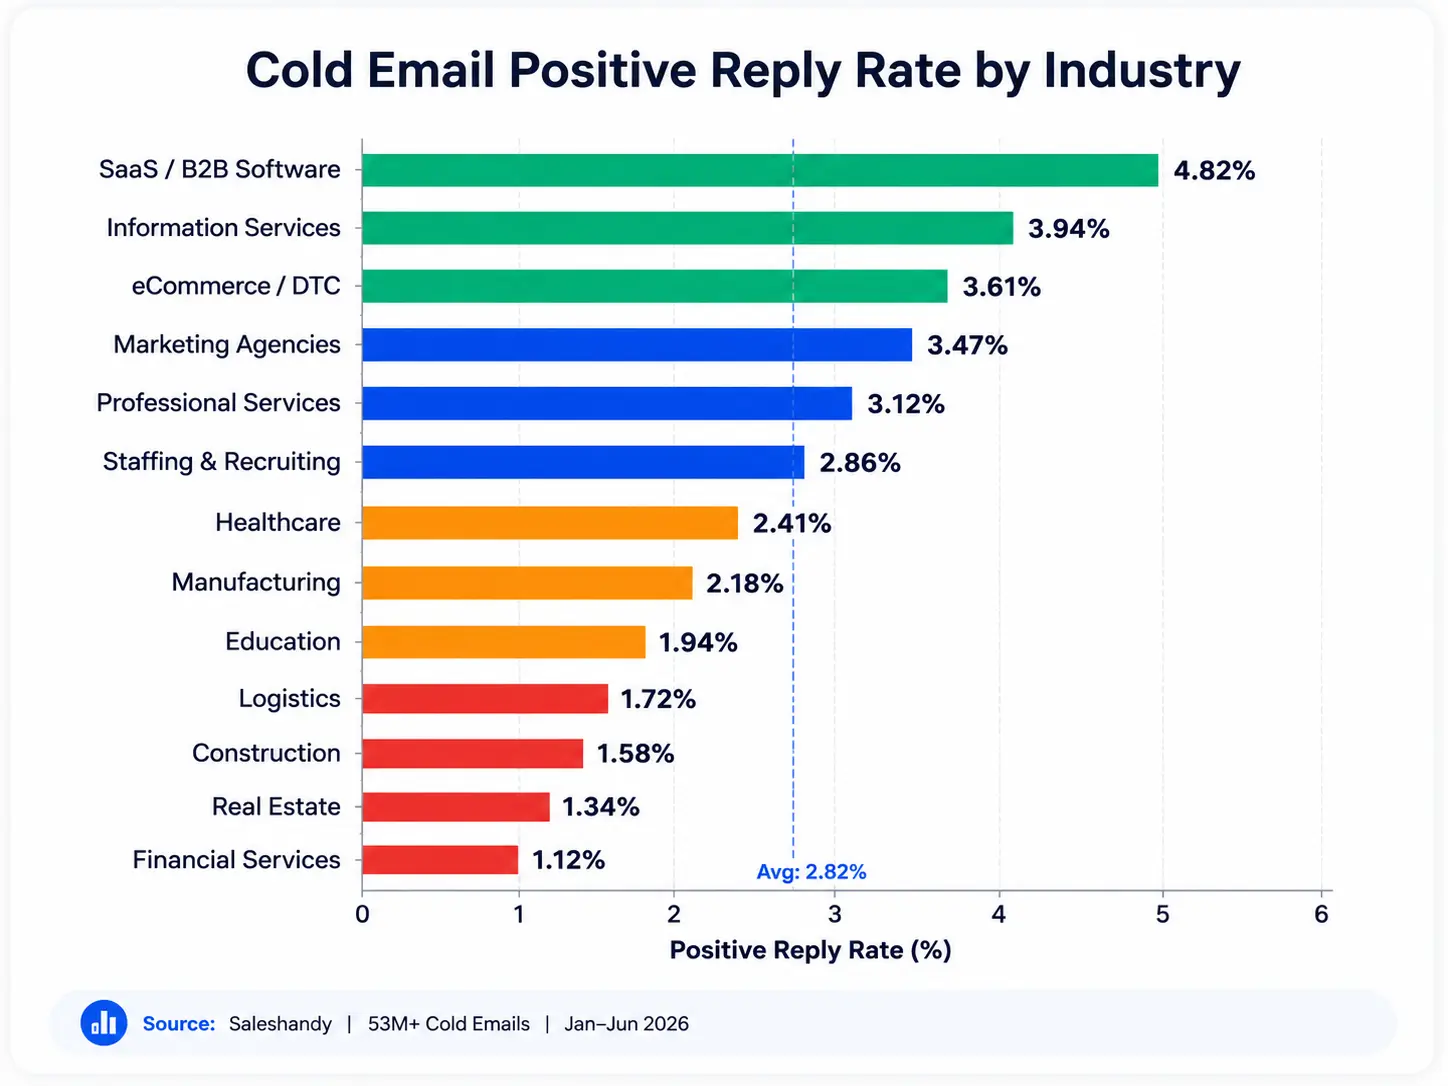
SaaS generated the highest reply rates in our analysis, followed by Information Services and eCommerce.
Financial Services and Real Estate produced the lowest engagement levels.
The difference comes down to buyer behavior.
Prospects in SaaS and Information Services are generally more accustomed to evaluating new tools, vendors, and solutions.
In contrast, industries such as Financial Services and Real Estate tend to be more relationship-driven and cautious toward unsolicited outreach.
💡Key Takeaway: Industry influences how receptive prospects are to cold outreach, but it doesn’t determine success. Strong targeting and messaging can outperform industry averages.
11. The Job Titles Most Likely to Reply Change With Company Size
The job titles generating the highest reply rates varied significantly based on company size.
- Under 50 employees: Founders and CEOs generated the highest reply rates.
- 50–500 employees: Managers and Directors were most likely to engage.
- 500+ employees: C-level executives generated the highest reply rates.
- As companies grow, buying decisions become more distributed.
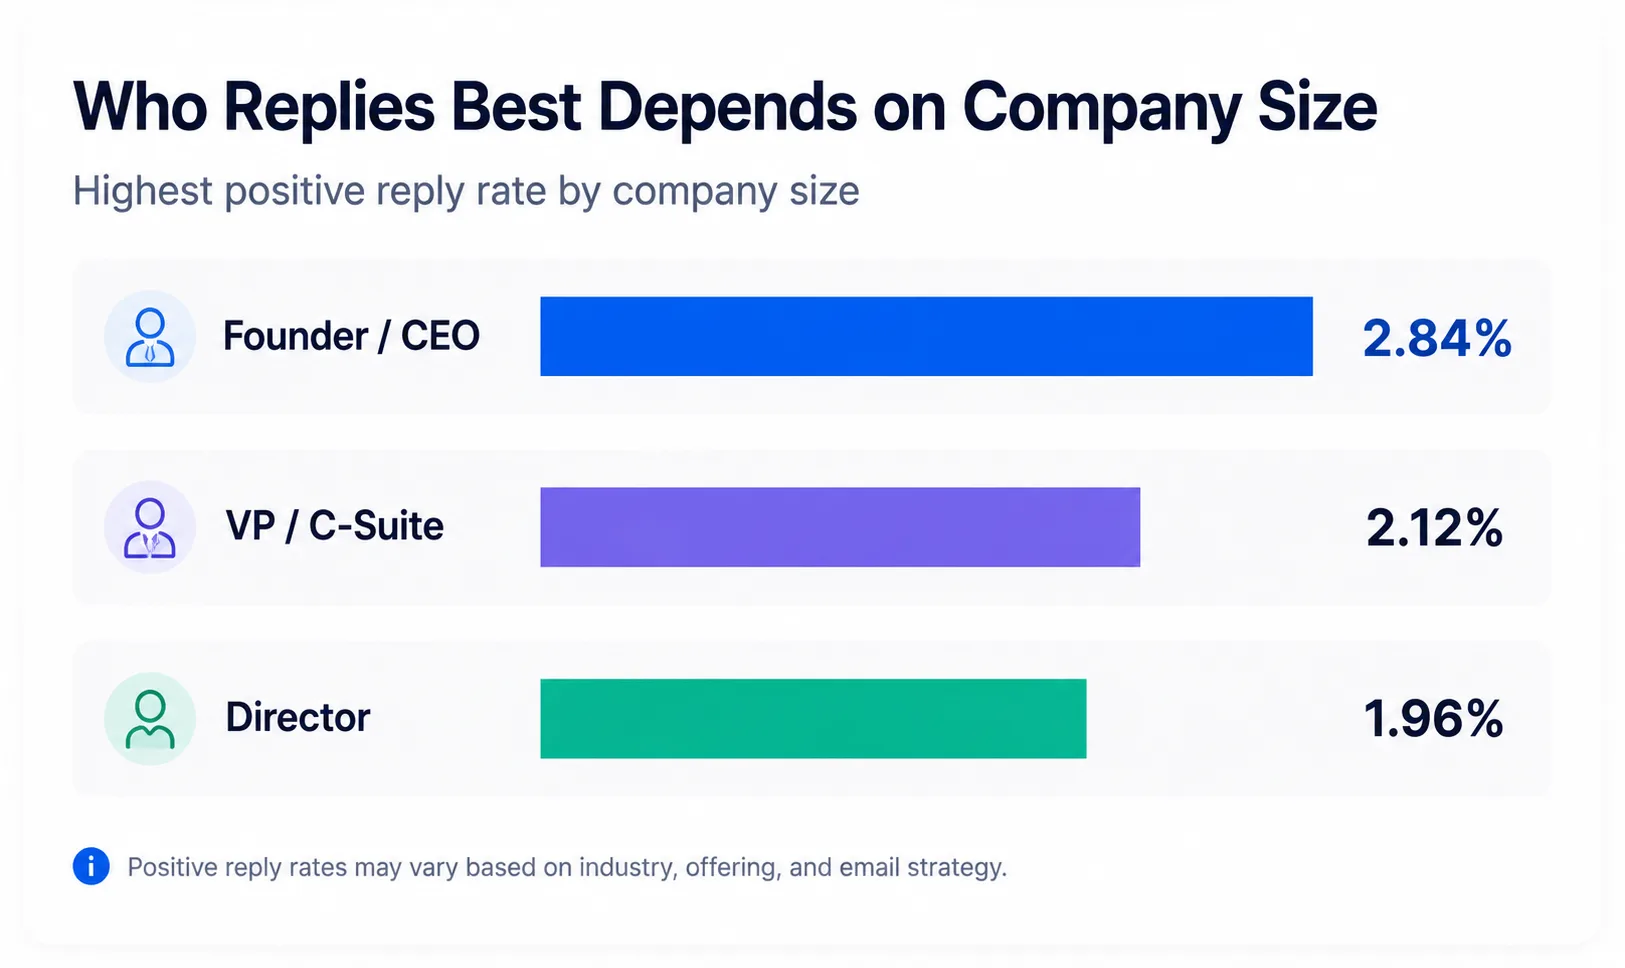
The person most likely to respond at a startup is often different from the person most likely to respond at an enterprise organization.
💡Key Takeaway: The same prospecting strategy rarely works across every company size. Align the job title you target with the size of the organization you’re selling to.
12. North America Leads All Regions in Cold Email Reply Rates
North America generated the highest reply rates, followed by Western Europe and the UK.
While other regions continue to grow as outbound markets, North American prospects remained the most responsive to cold email.
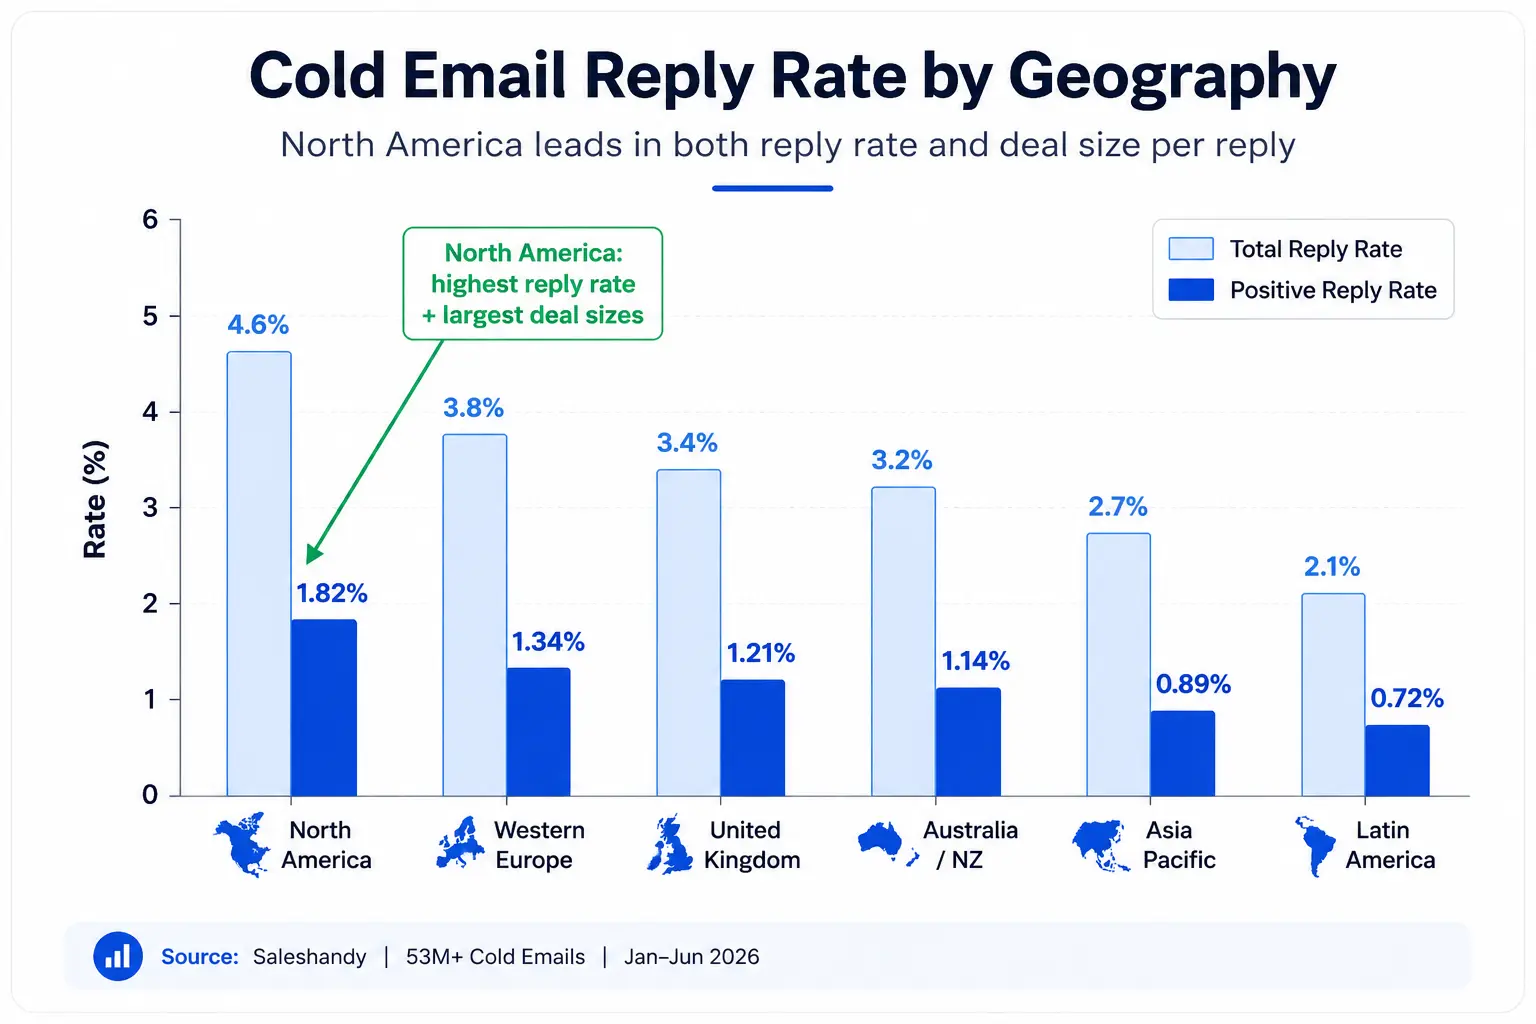
Interestingly, the US and India accounted for the majority of sending activity in our dataset, but North America continued to outperform every other region when measured by reply rates.
13. The Cold Email Conversion Rate Is 2 to 3 Meetings Per 100 Cold Emails
Every cold email metric eventually leads to one question: how many meetings does this actually book?
When everything is dialed in, the top-performing campaigns in our analysis book 2 to 3 meetings for every 100 cold emails sent.
That is the real cold email conversion rate for teams running verified data, hyper-personalized copy, soft CTAs, and multichannel follow-ups.
That is an excellent cold email success rate. Most campaigns fall well below it.
What 2 to 3 Meetings Per 100 Emails Looks Like at Scale
| Weekly Send Volume | Meetings Booked |
|---|---|
| 100 emails | 2–3 meetings |
| 250 emails | 5–8 meetings |
| 500 emails | 10–15 meetings |
| 1,000 emails | 20–30 meetings |
A team sending 500 cold emails per week can generate 10 to 15 meetings from outbound alone.
For many sales teams, that’s enough to build a predictable pipeline from a single channel.
4 Cold Email Trends to Watch in 2026
Cold email is still generating pipeline in 2026, but the way successful teams run outbound has changed significantly.
The biggest shift is a move away from volume-driven outreach toward relevance, automation, and buyer intelligence.
Trend 1: Agentic AI Is Replacing Manual Outbound Workflows
The most advanced outbound teams no longer use AI just to write emails.
They deploy orchestrated agents that handle the entire workflow:
- researching prospects
- enriching contact data
- identifying buying signals
- drafting personalized messages
- managing sequences (handling replies.)
In one internal test using Claude-based agents with Saleshandy’s MCP and API, agent-led outreach generated a 4% reply rate and a 2% positive reply rate without manual prospect research or email writing.
Trend 2: ESPs Are Evaluating Sending Behavior, Not Just Email Content
Deliverability is no longer only about avoiding spam words.
Google, Microsoft, and other providers increasingly evaluate sender behavior patterns, including who you email, how consistently you send, and whether your activity looks natural over time.
This means inbox reputation is becoming just as important as email copy.
Trend 3: A Strong Online Presence Is Becoming a Competitive Advantage
More prospects are researching the sender before replying.
The strongest outbound motions no longer rely on cold email alone. Prospects often see a founder’s LinkedIn content, company updates, customer stories, or social proof before responding to an email.
By the time the email arrives, the sender is already familiar.
Trend 4: More Sales Teams Are Adopting Multichannel Outreach
99% of cold outreach sequences in our dataset are still email-only. But the teams adding a second channel are seeing significantly stronger results.
| Channel Mix | Positive Reply Rate |
|---|---|
| Email Only | 0.11% |
| Email + LinkedIn | 0.21% |
| Email + Call | 0.28% |
| Email + LinkedIn + Custom Channel | 0.88% |
- Email + Call produces 2.5x the positive reply rate of email-only.
- Email + LinkedIn produces 1.9x. Multichannel adoption is still early, but the teams using it are pulling ahead fast.
Frequently Asked Questions About Cold Email Statistics
1. What Is a Good Cold Email Reply Rate in 2026?
A good cold email reply rate is anything above 5%. Our analysis of 53 million cold emails found that the average is 3.7%, but top 10% senders consistently hit 8 to 12%. The gap between average and elite almost always comes down to targeting and list quality, not copywriting.
2. What Is the Average Cold Email Open Rate?
The average cold email open rate in our dataset was 21%. However, many platforms report 40 to 55% because Apple Mail Privacy Protection and ESP pre-scanning inflate the numbers artificially. Treat open rate as a subject line signal, not a campaign health metric. Positive reply rate is a more accurate measure of performance.
3. How Many Follow-Ups Should I Send for a Cold Email?
4 to 6 emails spread over 20 to 21 days. In our dataset, 44.5% of all positive replies came from follow-up emails, not the initial send. Most senders give up after two emails and leave nearly half their results on the table.
4. What Is an Acceptable Bounce Rate for Cold Email?
Under 2%. Our data shows verified email lists bounce at 1.53%, while unverified lists hit 2.55%. Any campaign bouncing above 3% is actively damaging your sender reputation. Always verify before sending.
5. How Long Should a Cold Email Be?
Under 80 words. The best-performing campaigns in our dataset kept first emails between 50 and 80 words. That is enough to communicate one clear message and one soft ask. Longer emails get read less and replied to less.
6. What Is the Best Day and Time to Send Cold Emails?
Tuesday between 9 and 10 AM in the recipient’s local timezone. But timing is one of the smallest levers. The gap between the best and worst sending day is only 2.1%. Spend your optimization time on targeting and copy instead.
7. What Is the Cold Email Conversion Rate to Meetings?
2 to 3 meetings per 100 emails sent for top-performing campaigns. A team sending 500 emails per week should expect 10 to 15 booked meetings from outbound. The biggest bottleneck is response time to positive replies, not send volume.
8. Does Email Verification Actually Improve Cold Email Results?
Yes. Verified contact lists bounce 40% less than unverified lists (1.53% vs 2.55%). Despite this, 73% of cold email senders in our dataset skipped verification entirely. It is the single easiest fix for deliverability problems.
9. Does Adding a Second Channel Improve Cold Email Results?
Significantly. Email + Call produces 2.5x the positive reply rate of email-only, and Email + LinkedIn produces 1.9x. Yet 99% of outreach sequences are still email-only. Adding one channel is the fastest way to outperform competitors right now.
10. What Size Prospect List Gets the Best Cold Email Results?
Under 200 prospects. Campaigns targeting fewer than 200 people produce 2x the reply rate and 4.4x the positive reply rate of campaigns over 1,000. Open rates actually increase with larger lists, but replies collapse because targeting gets too broad.